Debugging Refresher
———–ASU CSE 365: System Security
GDB Walkthrough
embryogdb
GDB is a very powerful dynamic analysis tool.
level1: using the command ‘continue’ or ‘c’ to continue program execution
- We can use the command
startto start a program with a breakpoint set onmain - We can use the command
startito start a program with a breakpoint set on_start - We can use the command
runto start a program with no breakpoint set - We can use the command
attach <PID>to attach some other already running program - We can use the command
core <PATH>to analyze the coredump of an already run program
|
|
level2: figure out the current random value of register r12 in hex
You can see the values for all your registers with info registers. Alternatively, you can also just print a particular register’s value with the print command, or p for short.
For example, p $rdi will print the value of $rdi in decimal. You can also print it’s value in hex with p/x $rdi
|
|
level3: figure out the random value on the stack (the value read in from /dev/urandom).Think about what the arguments to the read system call are.
Examine the contents of memory using the x/<n><u><f> <address> parameterized command. In this format
-
<u>is the unit size to display-
Valid unit sizes are
b(1 byte),h(2 bytes),w(4 bytes), andg(8 bytes). -
1 2 3 4 5 6 7 8 9(gdb) x/4bx $rsp 0x7ffd419bf2c0: 0x02 0x00 0x00 0x00 (gdb) x/4hx $rsp 0x7ffd419bf2c0: 0x0002 0x0000 0x0000 0x0000 (gdb) x/4wx $rsp 0x7ffd419bf2c0: 0x00000002 0x00000000 0x419bf408 0x00007ffd (gdb) x/4gx $rsp 0x7ffd419bf2c0: 0x0000000000000002 0x00007ffd419bf408 0x7ffd419bf2d0: 0x00007ffd419bf3f8 0x00000001722e1d10
-
-
<f>is the format to display it in-
Valid formats are
d(decimal),x(hexadecimal),s(string) andi(instruction). -
1 2 3 4 5 6 7 8 9 10 11 12 13 14 15 16 17 18(gdb) x/4gd $rsp 0x7ffd419bf2c0: 2 140725704193032 0x7ffd419bf2d0: 140725704193016 6210592016 (gdb) x/4gx $rsp 0x7ffd419bf2c0: 0x0000000000000002 0x00007ffd419bf408 0x7ffd419bf2d0: 0x00007ffd419bf3f8 0x00000001722e1d10 (gdb) x/4gs $rsp #warning: Unable to display strings with size 'g', using 'b' instead. (gdb) x/4bs $rsp 0x7ffd419bf2c0: "\002" 0x7ffd419bf2c2: "" 0x7ffd419bf2c3: "" 0x7ffd419bf2c4: "" (gdb) x/4gi $rsp 0x7ffd419bf2c0: add (%rax),%al 0x7ffd419bf2c2: add %al,(%rax) 0x7ffd419bf2c4: add %al,(%rax) 0x7ffd419bf2c6: add %al,(%rax)
-
-
<n>is the number of elements to display.
The address can be specified using a register name, symbol name, or absolute address
For example, x/8i $rip will print the next 8 instructions from the current instruction pointer. x/16i main will print the first 16 instructions of main. You can also use disassemble main, or disas main for short, to print all of the instructions of main. Alternatively, x/16gx $rsp will print the first 16 values on the stack.x/gx $rbp-0x32 will print the local variable stored there on the stack.
You will probably want to view your instructions using the CORRECT assembly syntax. You can do that with the command set disassembly-flavor intel.
level4: figure out a series of random values which will be placed on the stack
-
stepi <n>command, orsi <n>for short, in order to step forward one instruction -
nexti <n>command, orni <n>for short, in order to step forward one instruction, while stepping over any function calls. The<n>parameter is optional, but allows you to perform multiple steps at once -
finishcommand in order to finish the currently executing function -
break *<address>parameterized command in order to set a breakpoint at the specified-address. -
continuecommand, which will continue execution until the program hits a breakpoint. -
display/<n><u><f>parameterized command, which follows exactly the same format as thex/<n><u><f>parameterized command
For example, display/8i $rip will always show you the next 8 instructions. On the other hand, display/4gx $rsp will always show you the first 4 values on the stack.
Another option is to use the layout regs command. This will put gdb into its TUI mode and show you the contents of all of the registers, as well as nearby instructions.
If we want to remove the display rule, use the undisplay <num>
|
|
level5: use gdb scripting to collect the random values
write commands to some file, for example x.gdb, and then launch gdb using the flag -x <PATH_TO_SCRIPT>. This file will execute all of the gdb commands after gdb launches. Alternatively, you can execute individual commands with -ex '<COMMAND>'
You can pass multiple commands with multiple -ex arguments. Finally, you can have some commands be always executed for any gdb session by putting them in ~/.gdbinit
You probably want to put set disassembly-flavor intel in there
example1
|
|
example2
|
|
Finally we should use the scripts below to help us to get the right random value.
|
|
after 8 times trying:
|
|
level6: automatically solves each challenge by correctly modifying registers / memory
Not only can gdb analyze the program’s state, but it can also modify it. You can modify the state of your target program with the set command.
set $rdi = 0to zero out $rdiset *((uint64_t *) $rsp) = 0x1234to set the first value on the stack to 0x1234set *((uint16_t *) 0x31337000) = 0x1337to set 2 bytes at 0x31337000 to 0x1337
Suppose your target is some networked application which reads from some socket on fd 42. Maybe it would be easier for the purposes of your analysis if the target instead read from stdin. You could achieve something like that with the following gdb script:
|
|
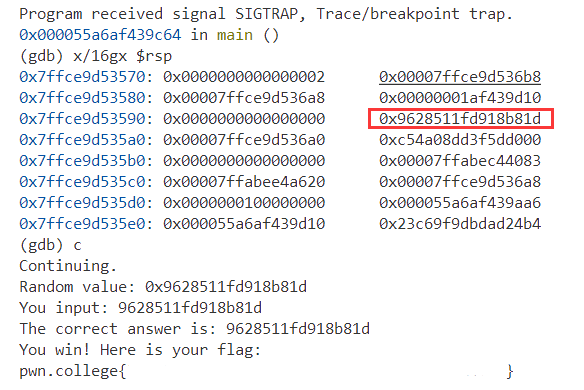
This example gdb script demonstrates how you can automatically break on system calls, and how you can use conditions within your commands to conditionally perform gdb commands.
- In this level we should look carefully at the logic of this program. First we can use
display/8i $ripto find out how the program works:
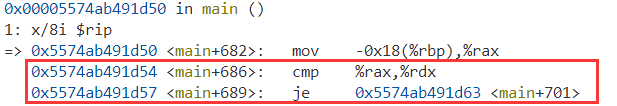
- If the value in rax is equal to value in rdx, it will jump to the main, not the exit. After several times it will go to the win function to print out the flag, so what we should do is break at the cmp and make them identical.
scripts like:
|
|
use:
|
|
level7: run the command call (void)win()
Under normal circumstances, gdb running as your regular user cannot attach to a privileged process. This is why gdb isn’t a massive security issue which would allow you to just immediately solve all the levels.
Running within this elevated instance of gdb gives you elevated control over the entire system.
|
|
level8: call (void)win() broke
Note that this will not get you the flag (it seems that we broke the win function!), so you’ll need to work a bit harder to get this flag!
First TRY
|
|
In this level we should find out why the program segment fault.
|
|
The error is at the <win+12>. mov [rbp-0x8], 0x0 and then <win+20> mov rax, [rbp-0x8]. In <win+24> mov eax, [rax] the [rax] ([0x0]) will make error. So we should jump out to the lea instruction and skip the segment faults.
|
|
NOTE: This level refers to this video and we can find it at there